

- Optimism’s active addresses surged 28%, but price remained trapped near critical support.
- Liquidation clusters and low volatility set the stage for a sharp breakout move.
Over the past week, Optimism [OP] has recorded a 28% surge in active addresses, outpacing other major Layer 2 networks, per Nansen data.
This rise in user activity has come at a time when OP’s price action remains suppressed within a prolonged downtrend.
Trading at $0.566 at the time of writing, the token sat just above a strong historical support zone. Despite the price stagnation, the uptick in network engagement signaled underlying strength.
The question now is whether this renewed on-chain momentum can finally ignite a sustained bullish reversal from current levels.
Can OP hold its ground?
For several months, OP has traded within a clearly defined descending channel, forming a series of lower highs and lower lows.
The price recently touched the lower boundary near $0.55 once again, a level that has consistently acted as short-term support. Each time OP revisits this region, it draws buying interest, reinforcing its significance.
However, repeated tests of this zone weaken its strength. If bulls fail to mount a recovery soon, the channel’s base could give way, exposing the token to a deeper retracement in the short term.
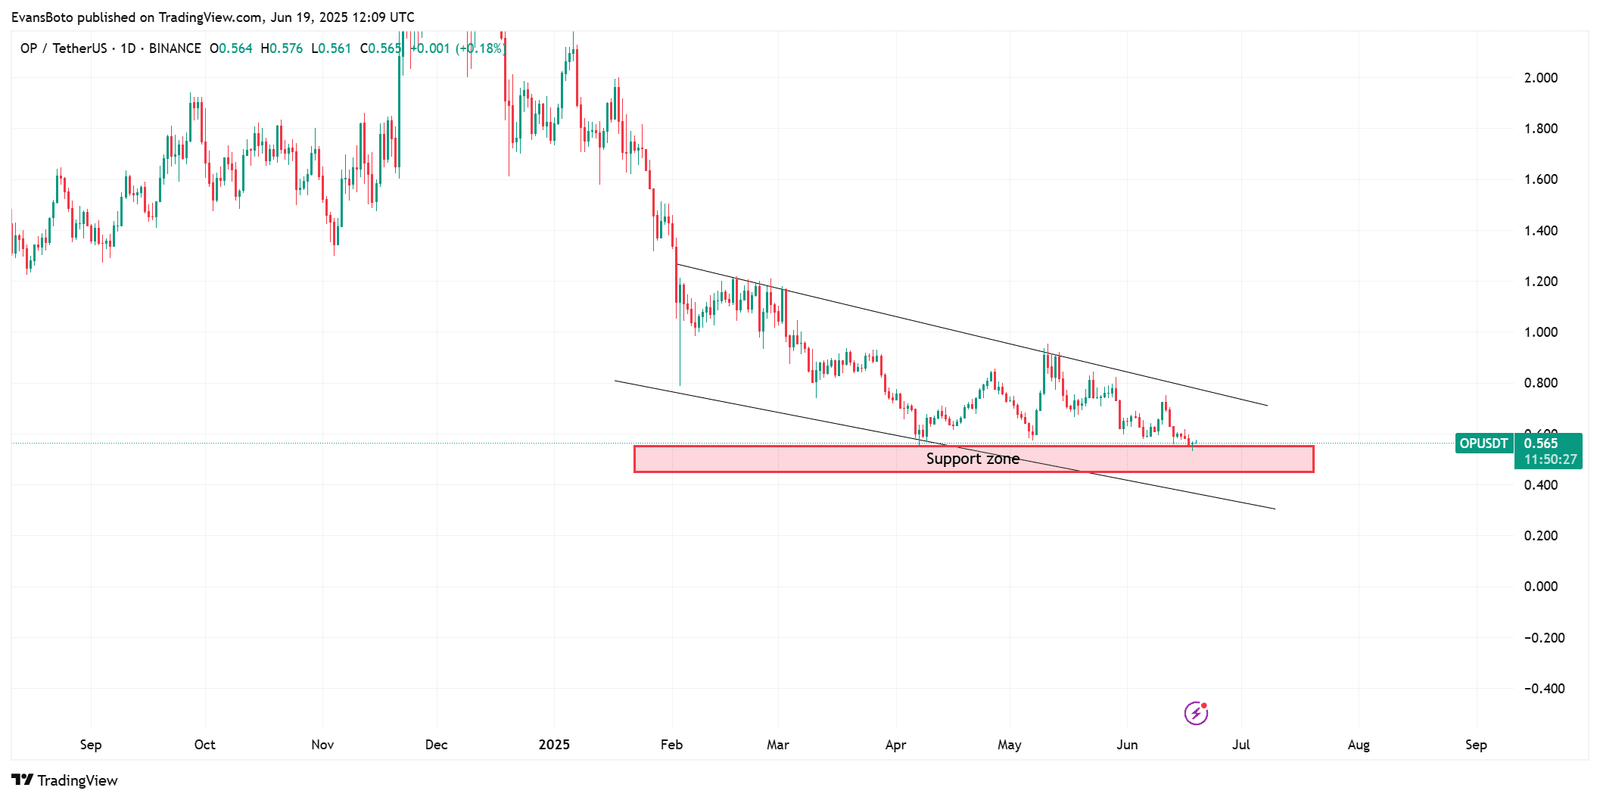
Source: TradingView
Is low volatility masking a bigger breakout?
OP’s 30-day volatility has declined sharply, dropping from a high of 143.81% to a recent low of 104.12%. This compression reflects reduced speculation and thinner price swings as the market waits for a clear directional catalyst.
Historically, such volatility squeezes near strong technical levels tend to precede explosive moves.
Given the confluence of support and falling volatility, the stage appears set for a possible volatility-driven breakout—or breakdown—depending on incoming sentiment and liquidity triggers in the coming sessions.
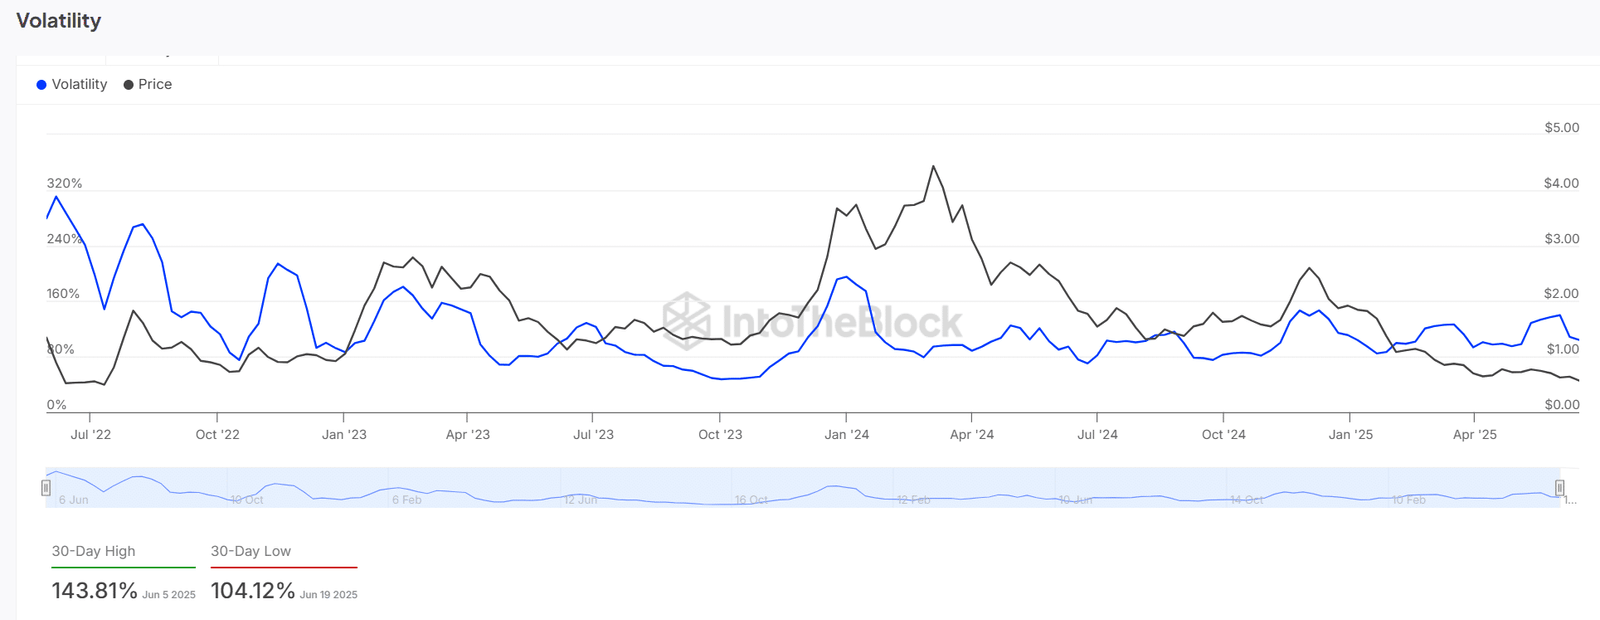
Source: IntoTheBlock
NVT ratio flashes warning
The Network Value to Transactions (NVT) ratio for OP has surged to 963.78, signaling that the token’s market capitalization has far outpaced its on-chain transaction volume.
This extreme reading often indicates overvaluation, especially when paired with declining price momentum. Unless network usage picks up meaningfully, the elevated NVT could trigger caution among investors.
Therefore, traders may need to factor in the risk of a potential correction if economic throughput fails to justify current valuation metrics.
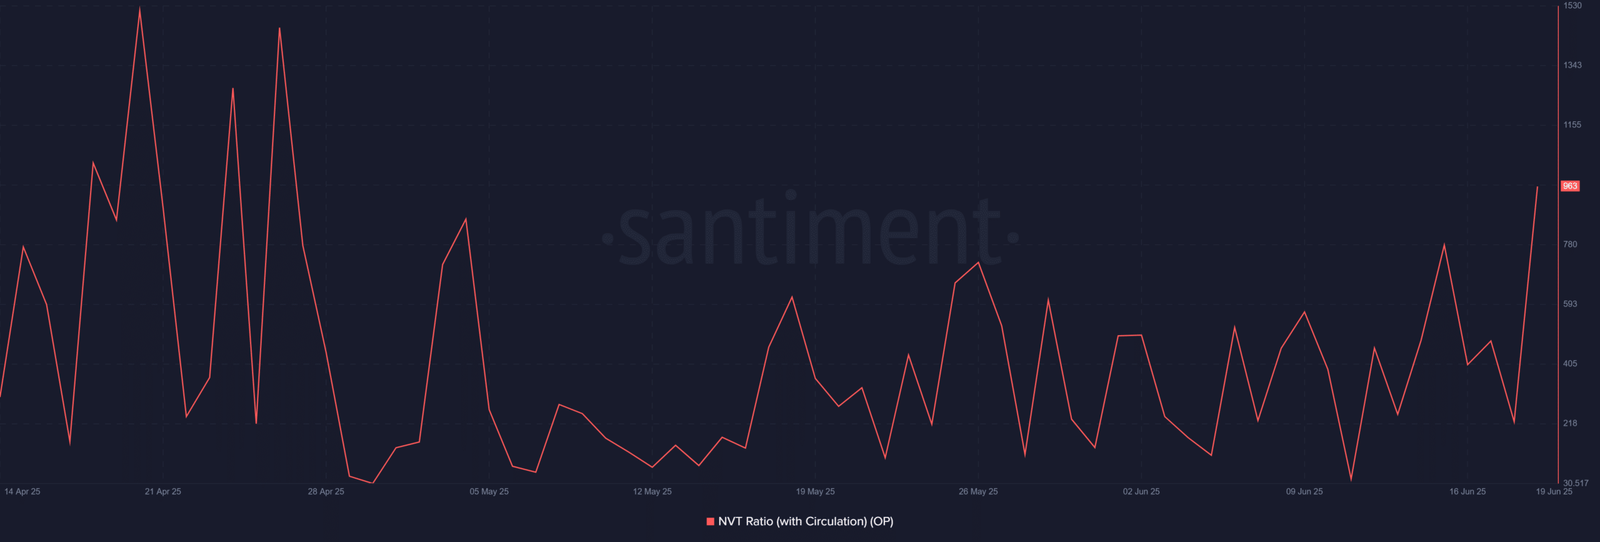
Source: Santiment
Are investors waiting for a catalyst?
Recent spot market data shows a nearly identical flow of capital into and out of OP on the 19th of June, with $5.32M in inflows matched by $5.31M in outflows.
This balance highlights the prevailing uncertainty in market sentiment. Neither bulls nor bears are willing to take decisive control, suggesting that traders are waiting for stronger signals before placing directional bets.
As a result, the current equilibrium reinforces the sideways price action seen around the $0.56 mark.
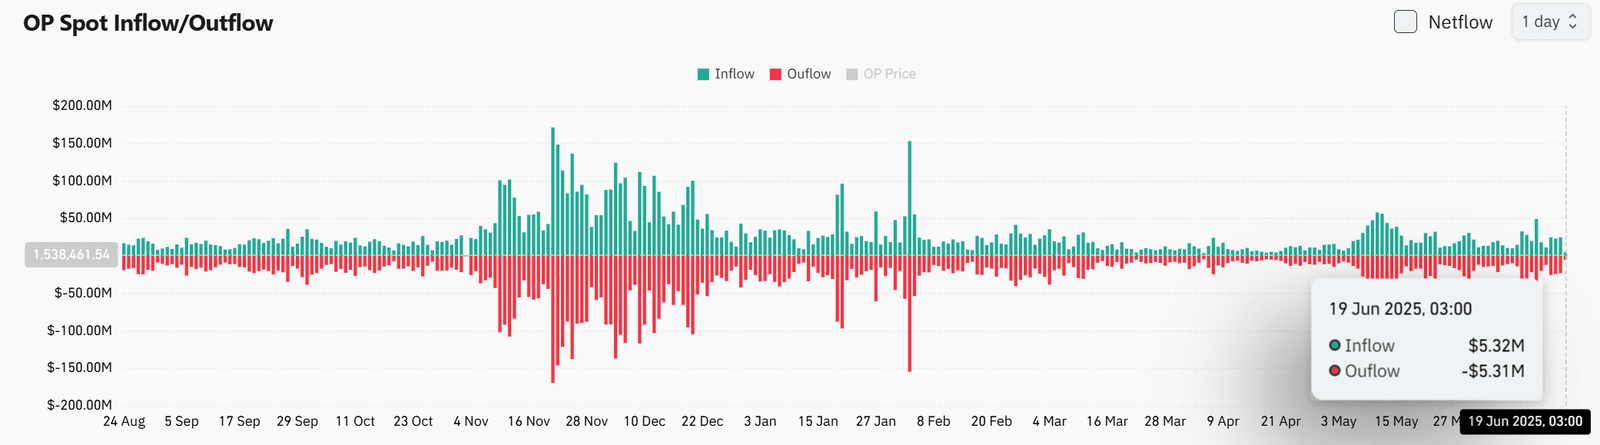
Source: Coinglass
Will liquidations act as fuel for the next big move?
The Binance OP/USDT liquidation heatmap shows significant long liquidation clusters just below $0.558 and dense short liquidations building above $0.575.
With price hovering between these two zones, any breakout or breakdown could trigger cascading liquidations, injecting sudden momentum into the market.
Traders holding leveraged positions should take caution, as volatility could rapidly accelerate in either direction once price begins to pressure either side of this liquidation range.
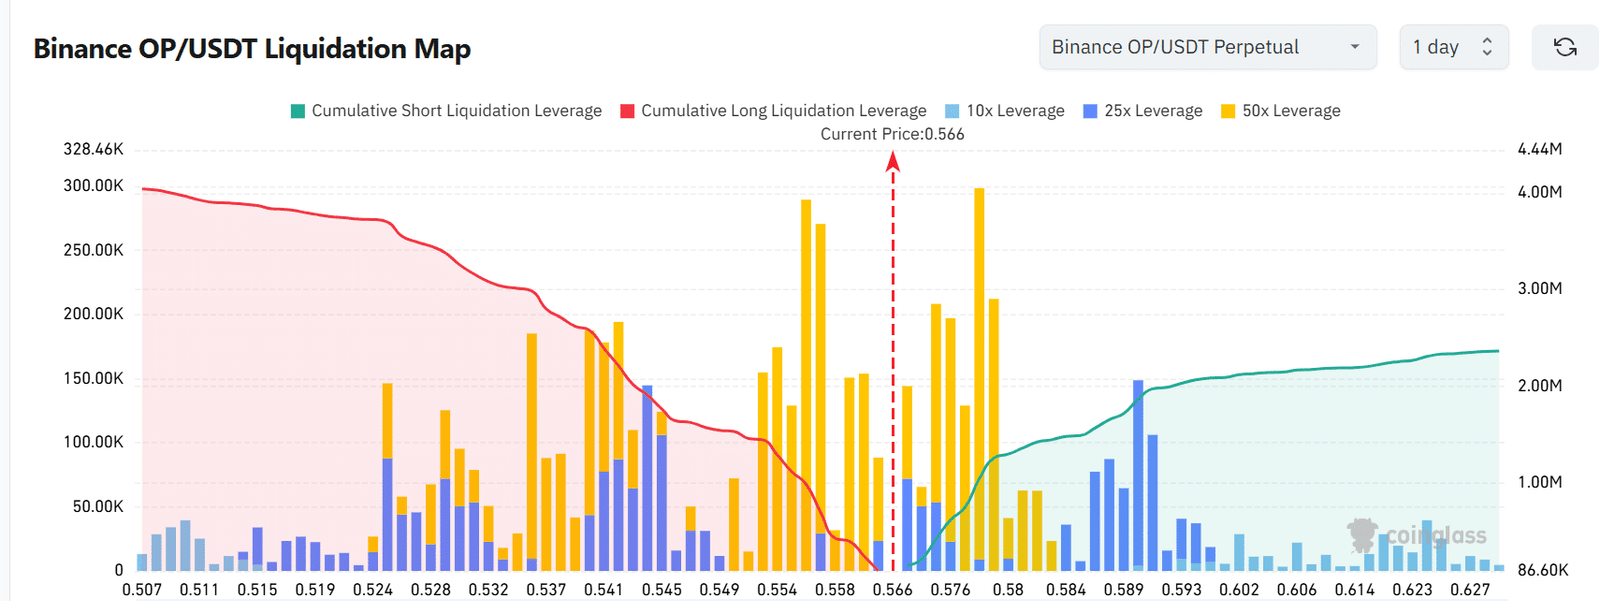
Source: Coinglass
Can Optimism break free from its downtrend soon?
While Optimism’s on-chain activity shows promising growth, technical and valuation metrics suggest the market remains undecided.
A decisive move above short liquidation zones could trigger a breakout, but risks remain as the elevated NVT ratio points to potential overvaluation.
For now, the battle between demand and caution continues at the $0.55–$0.57 range.