

- Mantra’s Large Transaction Volume declined 24.34%, pointing to weakening institutional participation amid the sell-off.
- 91% of OM holders remain at a loss, while short positions build near $0.25.
Mantra [OM] dropped by over 12% in a single day to trade at $0.2516, deepening a decline that began in early April and wiping out months of gains.
In fact, OM’s fall from above $8 has shown no meaningful recovery. Price now consolidates within a tight range, with low volume and momentum.
Despite this prolonged downtrend, indicators like the Parabolic SAR and Stochastic RSI still show no clear bullish signal. Can the token survive this brutal correction, or is more downside inevitable?
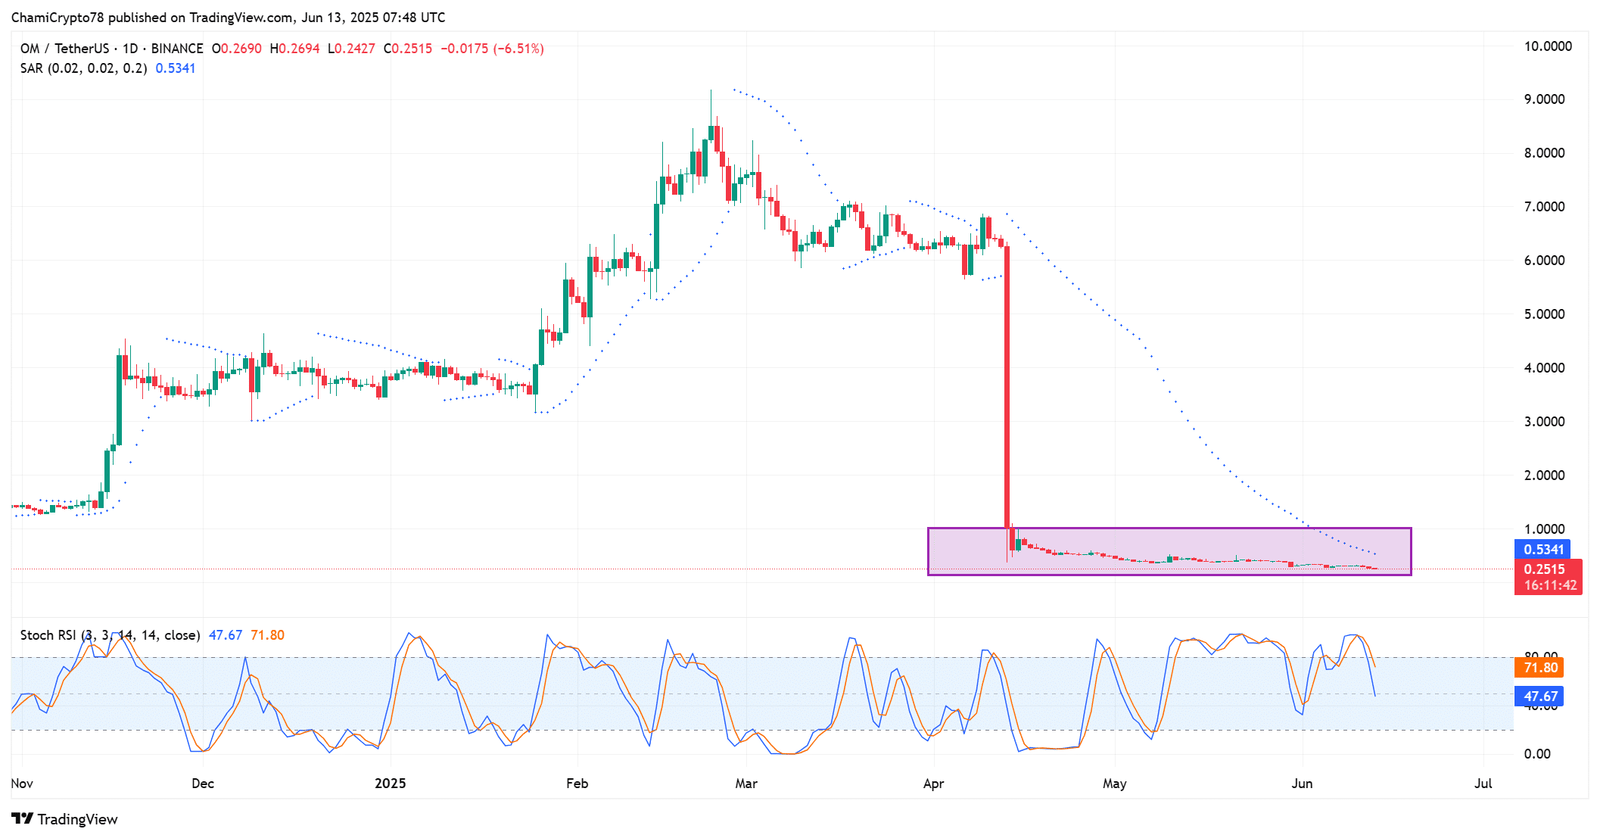
Source: TradingView
Can retail keep up with the pace?
Over the past 30 days, whale addresses increased their holdings by 2%, showing strong conviction despite price weakness.
Meanwhile, retail and mid-tier investors have pulled back, with their holdings dropping 7.56% and 4.33%, respectively.
This concentration suggests rising centralization. While it may reduce volatility, it also sidelines broader community engagement, making recovery less likely.
On-chain data confirmed this weakness.
Large Transaction Volume dropped 24.34%, indicating waning interest from big players just when support was most needed.
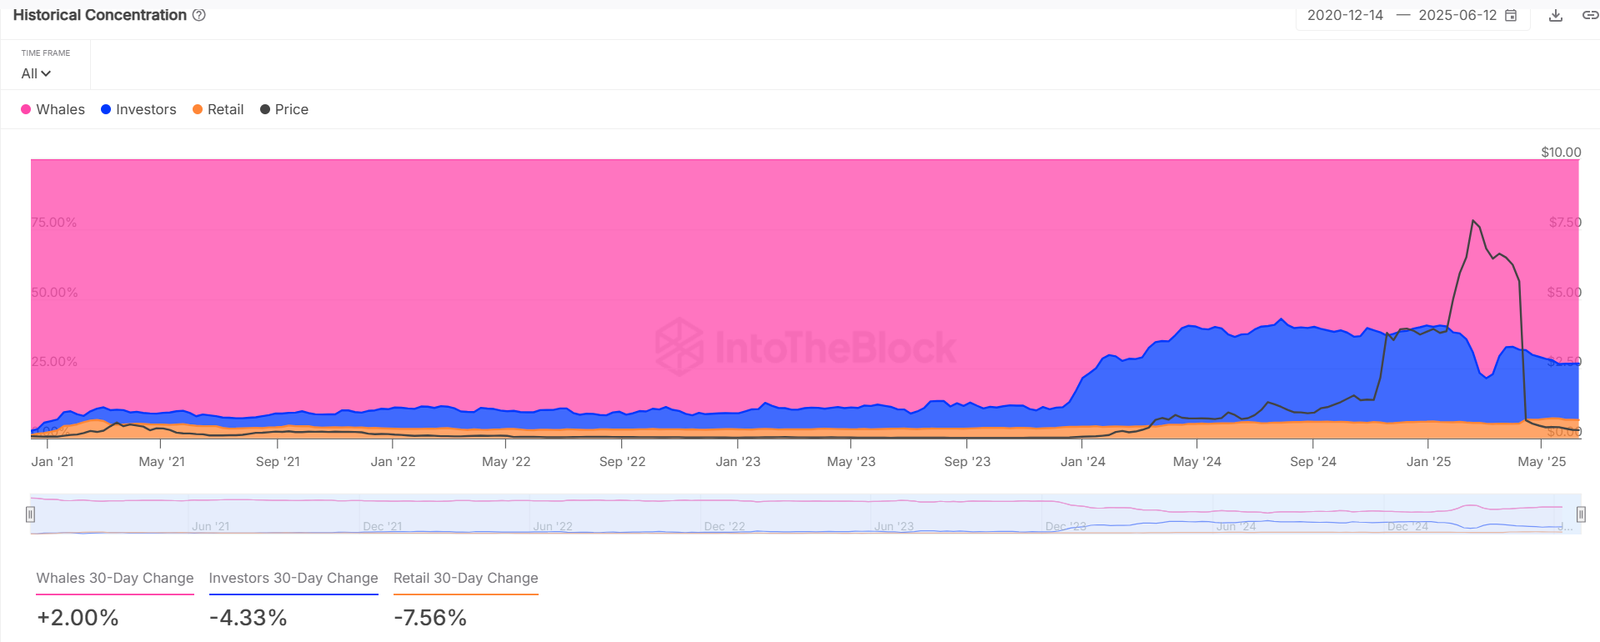
Source: IntoTheBlock
When large transactions decline during a price drop, it often implies weakening confidence among deep-pocketed players.
Why are new addresses rising?
Oddly enough, New Addresses grew by 18.6% last week. But that optimism faded quickly—Active Addresses increased only 0.44%. This gap revealed a deeper issue: low engagement. Many new wallets appeared idle or speculative.
On top of that, Zero-Balance Addresses dropped 17%, hinting that older users may have left the ecosystem entirely.
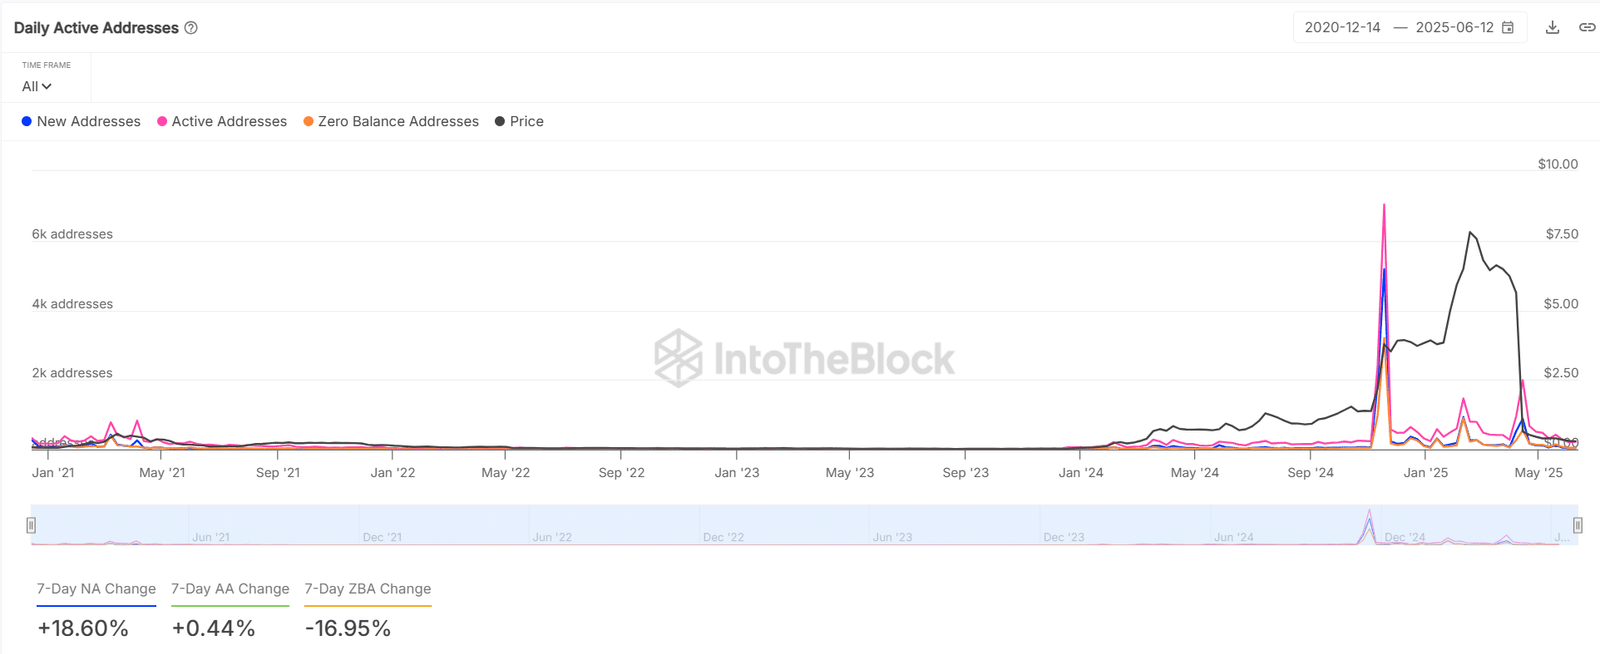
Source: IntoTheBlock
91% of OM holders trapped: Can they wait it out?
An alarming 91.91% of OM holders remain ‘Out of the Money’. This overwhelming underwater majority could trigger sell-offs if the price rebounds, creating overhead resistance.
The clustering of losses between $0.28 and $0.76 highlights how deeply investors are trapped. Unless a strong catalyst appears, the sentiment may worsen as time goes on.

Source: IntoTheBlock
Are short sellers getting too comfortable near $0.25?
According to the Liquidation Heatmap, short positions are piling up just above $0.2517. Short Liquidation Leverage has been rising, while long liquidations are already flushed below $0.24.
This imbalance suggests the market is heavily skewed toward downside speculation. However, if OM were to unexpectedly spike, it could trigger a short squeeze.
That said, in the absence of buying pressure, shorts remain firmly in control for now.
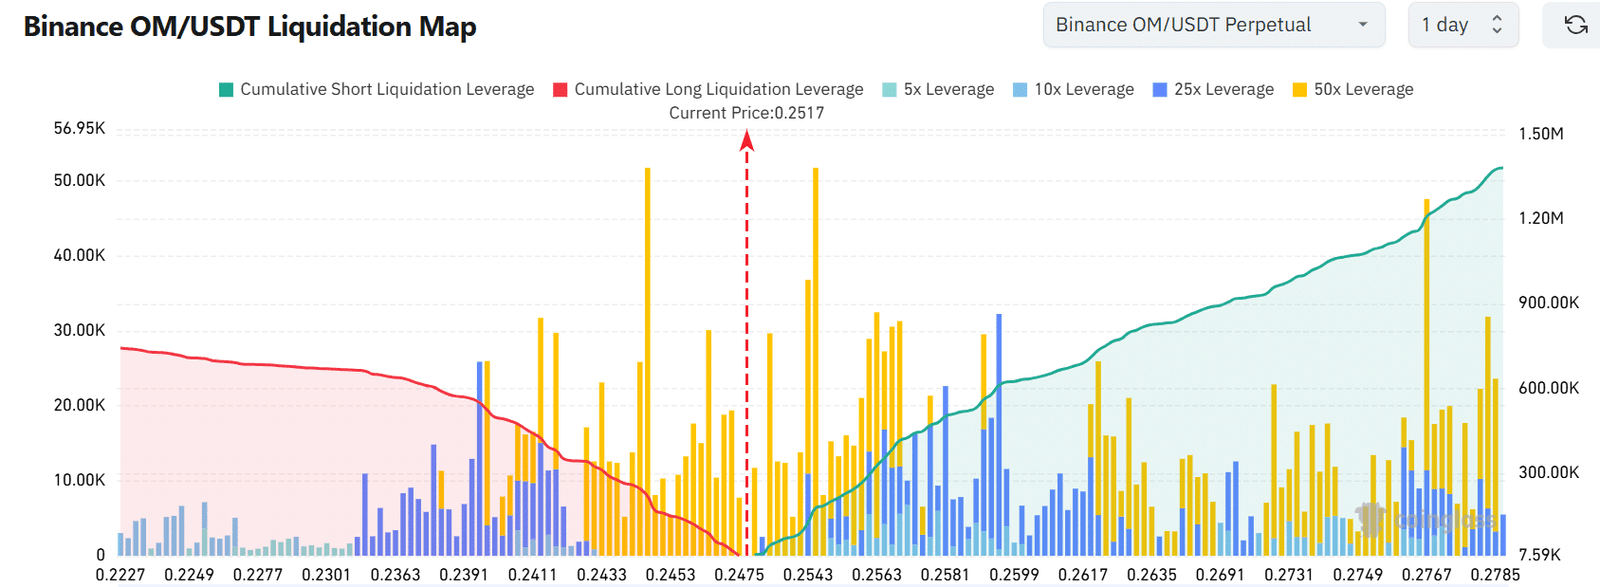
Source: CoinGlass
Is OM nearing exhaustion or primed for collapse?
The data paints a clear picture of sustained weakness across price, volume, and on-chain participation.
While whales continue to dominate supply, the lack of new demand and the overwhelming number of underwater holders make recovery extremely difficult.
Unless sentiment improves dramatically, OM may continue to drift lower, with short sellers reinforcing the downtrend.
A short-term bounce is possible, but a full reversal appears unlikely without a major shift in fundamentals.