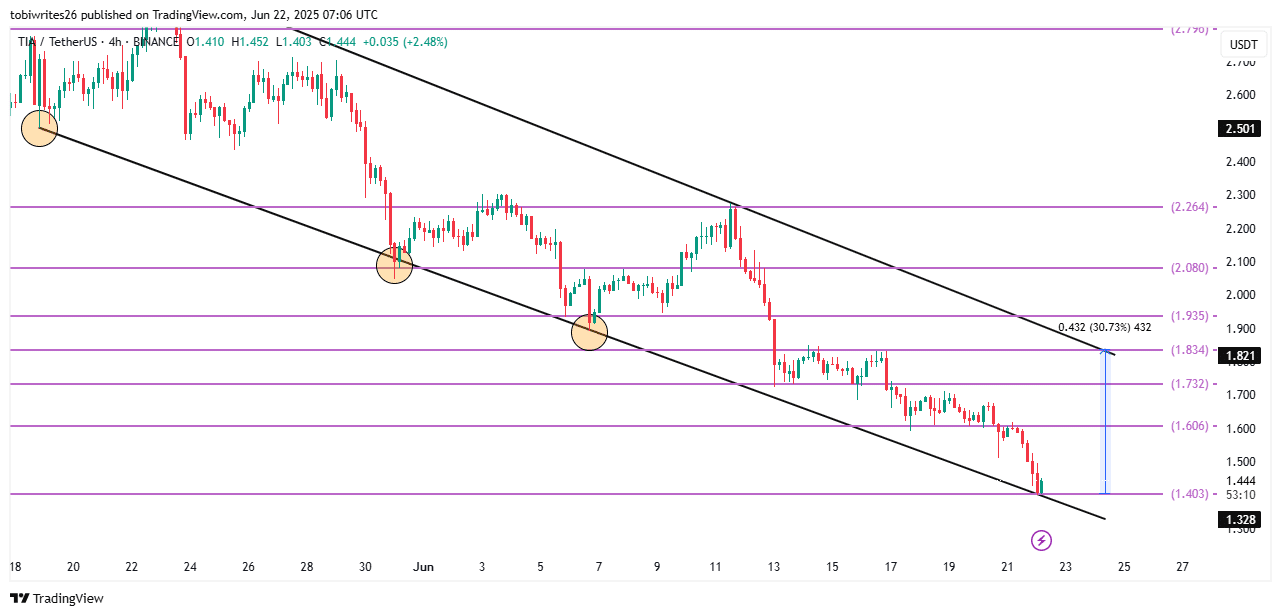
- TIA tapped a descending channel support that triggered prior rebounds, making it a key level to watch.
- Will this recent burst of buying activity be enough to push Celestia’s price significantly higher?
Celestia [TIA] dropped 11% in the last 24 hours, dragged down by the same market headwinds that sent Bitcoin [BTC] tumbling from $106K to $102K.
Despite the decline and heightened geopolitical tensions, investors appeared to treat the dip as a buying opportunity.
Is this another case of smart money stepping in, or a misread of a weakening trend?
Accumulation rises – What are investors up to?
TIA has seen a notable uptick in accumulation over the past 24 hours amid the ongoing market decline.
According to CoinGlass’s Spot Exchange Netflow, roughly $401,000 worth of TIA has been purchased in this period, pushing the weekly total to $6.94 million.
In fact, this marked the token’s highest weekly inflow in over three weeks.
This interest wasn’t limited to spot markets.
The Open Interest Weighted Funding Rate came in positive at 0.0002%, showing traders are still leaning bullish despite volatility.
If that metric trends higher, it would reflect growing long-side conviction among derivatives participants.
Accumulation slowly gains momentum
On-chain indicators backed the buying thesis.
At the time of writing, the Accumulation/Distribution (A/D) Line climbed modestly to 39.85 million, showing that more tokens are being bought than sold.
Naturally, this builds a case for a slow but steady influx of demand.
That’s further confirmed by the Money Flow Index (MFI), which moved up to 32.15.
Although still below the 50 mark, this uptick signals that liquidity is returning, possibly setting the stage for a more sustainable move.
Will history repeat for TIA?
AMBCrypto’s analysis showed that current buying pressure emerged just as TIA traded at a key support level on the chart.
This support lies at the lower boundary of the descending channel, which has triggered an upswing on three previous occasions.
While the outlook from this level remains bullish, Fibonacci Retracement analysis reveals two major obstacles on the way to the channel’s resistance.
The first resistance level lies at $1.606, followed by $1.732.
If TIA breaks past both resistance levels, bulls could target $1.834, implying a 30% rally from current prices.
Having said that, failure to break out could mean more sideways action until new momentum builds, especially if liquidity cools off again.


